Automated discovery of interpretable gravitational-wave population models 
Kaze W.K Wong (Flatiron Institute), Miles Cranmer (Princeton University); (equal contribution)
TL;DR
- There will be more and more gravitational wave (GW) events in the coming decade.
- To study the GW population, people usually write down simple phenomenological models.
- But that’s hard to do when your data is getting more complex, so people turn to flexible models like Gaussian Mixture Model. The problem is, these models are not interpretable.
- Symbolic regression can help distilling interpretable models from the flexible models
- We apply this to gravitational wave data, but this can be applied to other problems as well!
Main poster (~2 minutes read)
Increasing number of gravitational wave events
Phenomenological modelling of the GW population
Flexible model
- Large number of parameters.
- Parameters are in non-intuitive basis.
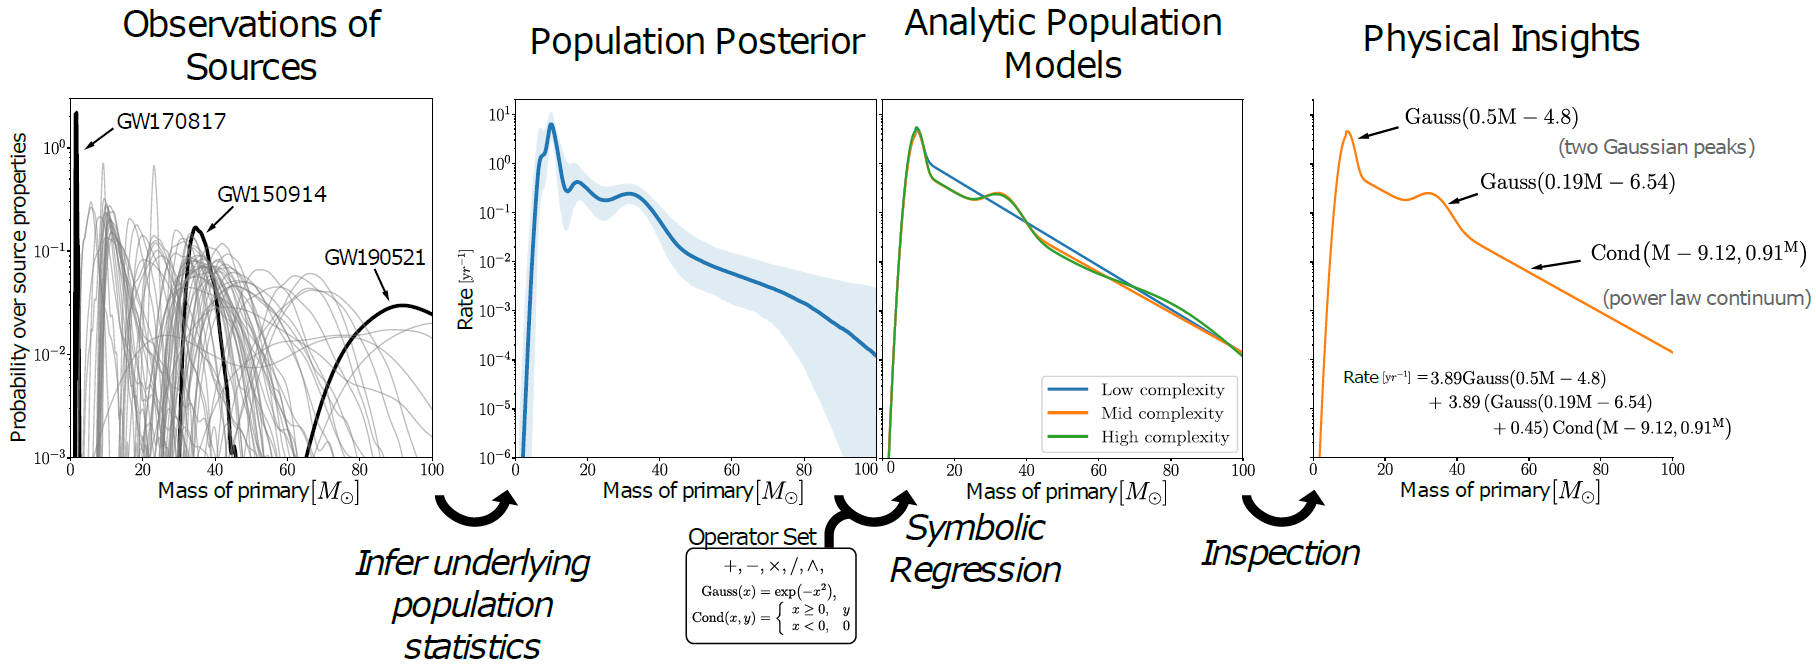
Symbolic regression primer
Interpreting flexible model's result
Take home messages
Flexible models are very popular in data analysis due to their capability to fit complex dataset. However, they are often difficult to interpret due to their large number of parameters in some non-intuitive basis. SR can be a tool to distill more interpretable out of these flexible models. Perhaps the coolest part of this work is the result you get out of the pipeline is a collection of models, which means you can use these models in typical data analysis tasks such as parameter estimation or model selection (And print it in your paper). One can surely take the equations fitted by SR and try to make scientific conclusion with them. But in case the referee ask “What about this robustness check?”, just plug it in a traditional data analysis pipeline, and all follows. After all, what’s the difference between a carbon-based ConvNet who look at data and propose equations and a silicon-based one?
A couple more things
Showyourwork

Our paper is prepared using the package showyourwork, which is a workflow management tool for reproducible, extensible, transparent, and just downright awesome open source scientific articles (in their own wording). You can find the source code of our latex file, data file and script which generate the figures in this github repository. We welcome comments in the form of github issue. If you think reproducibility and openness are important to scientific publication, give showyourwork a try!
Manim animation
![]()
The animation in this poster is made using an animation engine for explanatory math videos in python, which is originally developed by Grant Sanderson for his YouTube channel 3Blue1Brown, then subsequently being developed by the manim community. We use the community version for the videos in this poster. If you are interested in start making explanatory video in this style, checkout the engine! Also, the source code for creating the animations in this poster can be found in this repo.
The authors

Kaze is a Flatiron research fellow at the Flatiron Institute, who works mostly on everything related to gravitational waves (expect instrumentation.) He also tries to apply machine learning methods such as normalizing flow to solve modern data analysis problems in astrophysics. He loves making animations and he tries to make one animation for each paper he publishes. Twitter GitHub Youtube

Miles is a PhD candidate at the Princeton University working on the intersection between astrophysics and machine learning. He is the main contributor and maintainer of a population symbolic regression python package called PySR. Twitter GitHub